
Published MSP rates run $100 to $400 per user per month, but the range is useless without the arithmetic. Build the price up: a fully loaded engineer at $110,000 across 100 seats is roughly $92 per seat monthly, plus $20–40 overhead and $25–100 in tooling. Mark up 60 to 100 percent and hold gross margin above 50 percent.
Every pricing guide on the first page of this search is published by an MSP, or by a vendor selling to MSPs. Each one quotes a range. None of them shows the arithmetic underneath it.
That is not an oversight. Publishing the buildup means publishing your margin, and no operator wants their own clients reading it. So the genre has settled into quoting bands — $100 to $400, $150 to $250, “it depends on your stack” — which is a number the reader cannot apply to their own payroll.
A range is not an answer. Here is the arithmetic.
- Seat count moves the price more than service scope does. Published bands cluster at $70–150 per user for 1–50 seats, $100–250 for 75–150 seats, and $200–400+ where a compliance regime is in play. Quote a small client at a large-client rate and you lose the deal; quote the reverse and you lose the business.
- Start from loaded labour, not from a competitor’s price sheet. A $110,000 fully loaded engineer covering 100 seats is $1,100 per seat per year — roughly $92 per seat per month, before a single tool licence.
- Overhead runs $20–40 per seat per month and tooling $25–60 for a standard SMB stack, rising to $50–100 once you carry a real security stack. Both are routinely omitted from published buildups, which is how a plausible-looking price arrives underwater.
- Markup and margin are not the same number. Gross margin equals markup divided by one plus markup. A 60 percent markup yields a 37.5 percent gross margin, not 60. You need a 100 percent markup to reach 50 percent gross margin. Most published guidance recommends both figures simultaneously without noticing they contradict each other.
- Regulated verticals are not a premium, they are a different cost structure. Evidence collection, documented change control and audit response are labour you will perform whether or not you priced for them.
How much should an MSP charge per seat per month?
Published rates run $100 to $400 per user per month, and the spread is real rather than sloppy — it reflects seat count, stack depth and compliance exposure, not vendor disagreement. But the range is where the useful advice stops in every guide that quotes it. Adopting a competitor’s number tells you nothing about whether it covers your payroll, your tools and your overhead. Build the price from your own costs and check it against the band afterwards.
The bands, as published across the current guides:
| Seat band | Typical published range | What drives it |
|---|---|---|
| 1–50 seats | $70–150 per user / month | Fixed account overhead spread thin; often a lighter stack |
| 51–75 seats | $90–200 per user / month | Transition zone; stack usually standardises here |
| 75–150 seats | $100–250 per user / month | Best efficiency; overhead well amortised |
| 150+ seats | $90–200 per user / month | Volume pressure returns, offset by contract stability |
| Any size, regulated | $200–400+ per user / month | Evidence, audit response, documented change control |
Use that table to sanity-check a price. Do not use it to set one. The next section is how you set one.
How do you actually calculate cost per seat?
Three components, added, then marked up. Take one engineer’s fully loaded annual cost, divide by the number of seats that engineer can realistically support, divide by twelve. Add per-seat overhead — rent, admin, insurance, software that is not client-facing. Add per-seat tooling, itemised licence by licence. That total is your break-even. Everything above it is margin, and everything you forgot to count comes out of it.
Step 1 — loaded labour
“Fully loaded” is not salary. It is salary plus employer taxes, benefits, paid time off, training, recruitment amortised, equipment and the share of management time that engineer consumes. The multiplier on base typically runs 1.25 to 1.40.
Anchor the base to published data rather than to whatever you happen to pay. The US Bureau of Labor Statistics puts the median annual wage for Network and Computer Systems Administrators — SOC 15-1244, the closest occupational match — at $99,130, or $47.66 an hour, in the May 2025 Occupational Employment and Wage Statistics. That series covers all industries, including enterprise and government internal IT, and MSP delivery engineers generally sit below it: a mid-level MSP engineer in a Tier-1 market more commonly carries a base of $75,000–85,000, which loads to $105,000–120,000.
Carry both numbers, because the gap between them is a real input and not a rounding argument. The worked example below uses $110,000 loaded, implying a base near the top of the MSP band. An engineer paid at the BLS median loads to roughly $130,000 — which is $108.33 per seat per month across 100 seats instead of $91.67, an 18 percent increase in the largest line of the buildup before anything else on the page changes.
The second input is harder and matters more: how many seats can one engineer actually carry? The honest answer depends on stack standardisation, ticket volume per seat and how much project work leaks into the managed-services week. A well-standardised environment supports more seats per engineer than a heterogeneous one, and the gap is large — this is the single highest-leverage number in the entire model, and it is the one most operators have never measured.
For the worked example: $110,000 loaded, 100 seats.
$110,000 ÷ 100 seats           = $1,100 per seat per year
$1,100 ÷ 12                    = $91.67 per seat per month
That is before a single licence. If your engineer covers 70 seats instead of 100, the same salary becomes $130.95 per seat per month — a 43 percent increase in your largest cost line, driven entirely by an operational metric most operators do not track.
Step 2 — overhead
Rent, utilities, insurance, accounting, non-billable admin staff, internal software, phone systems, the office coffee. Divide annual overhead by seats under management and by twelve.
For most SMB-focused MSPs this lands at $20–40 per seat per month. Use $30 for the worked example. This is the component most commonly missing from published buildups, and its absence is invisible until year-end.
Step 3 — tooling, itemised
Every guide says “plus tools.” Almost none itemises them. Per seat, per month:
| Tool category | Typical per seat / month |
|---|---|
| RMM | $3–6 |
| PSA (allocated share) | $3–5 |
| EDR / antivirus | $4–8 |
| Email security | $2–4 |
| Microsoft 365 backup | $3–5 |
| Documentation platform | $2–4 |
| Patch management / DNS filtering | $2–4 |
| Core stack subtotal | $19–36 |
| SOC / MDR (if carried) | +$15–35 |
A core SMB stack lands at $19–36. Add a security operations layer and the realistic ceiling is $71. For the worked example, use $45 — a core stack at $30, plus $15 for a partial MDR allocation. Note that this is a deliberate, stated composition rather than a round number chosen because it looked reasonable.
The buildup
| Line | Per seat / month |
|---|---|
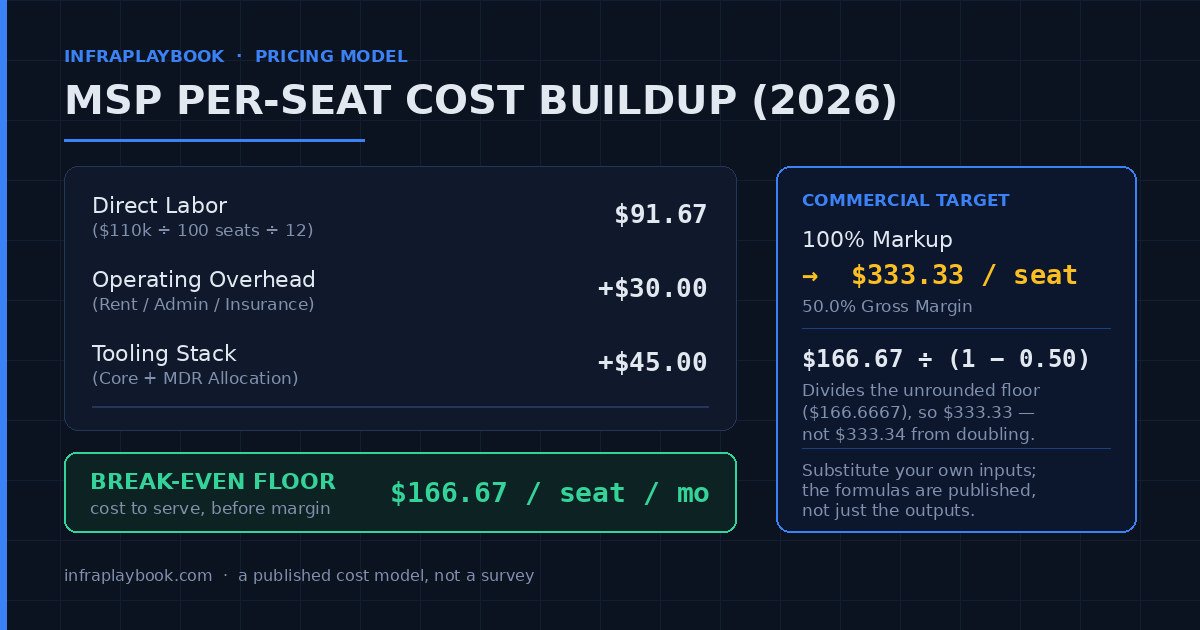
| Loaded labour ($110,000 ÷ 100 seats ÷ 12) | $91.67 |
| Overhead | $30.00 |
| Tooling (core $30 + partial MDR $15) | $45.00 |
| Break-even cost per seat | $166.67 |
Now the price:
| Markup | Price per seat / month | Gross margin |
|---|---|---|
| 60% | $266.67 | 37.5% |
| 80% | $300.00 | 44.4% |
| 100% | $333.33 | 50.0% |
| 120% | $366.67 | 54.5% |
Those gross margin figures are the point of this article, and they are covered in the next section.
What margin should you hold?
Mark up 60 to 100 percent over fully loaded cost, and treat 50 percent gross margin as the health bar rather than the ambition. But the two numbers are not interchangeable, and conflating them is the most common arithmetic error in published MSP pricing advice. Gross margin equals markup divided by one plus markup. A 60 percent markup produces a 37.5 percent gross margin. To reach 50 percent gross margin you need a 100 percent markup — a doubling.
Written out:
GM% = markup ÷ (1 + markup)

  60% markup  →  0.60 ÷ 1.60  =  37.5%
  80% markup  →  0.80 ÷ 1.80  =  44.4%
 100% markup  →  1.00 ÷ 2.00  =  50.0%
 120% markup  →  1.20 ÷ 2.20  =  54.5%
Read the standard advice again with that in hand. “Mark up 60 to 100 percent and hold gross margin above 50 percent” recommends a range whose lower half cannot satisfy its own second condition. An operator following the low end of the markup guidance and believing they are meeting the margin guidance is 12.5 points under the bar and has no reason to suspect it.
Why 50 percent is the floor and not the target: at 50 percent gross margin, half of every contract dollar remains after direct delivery cost, and that half has to fund sales, management, tooling not allocated per seat, bad debt, scope creep, and the client who consumes three times the average ticket volume. Scope creep is the line item most often left uncosted here, and it is the one that moves margin fastest — how to price out-of-scope MSP work covers the boundary and the billing model that stops it being absorbed silently. Below 50 percent, one bad-fit client absorbs the profit from three good ones, and the business becomes a mechanism for converting your engineers’ time into someone else’s operating leverage.
The corollary is that a price is not too high because a prospect said so. It is too high when a client at that price is unprofitable to serve, which is a question about your cost model, not about their reaction.
Why does seat count change the per-seat price?
Because a meaningful share of the cost of serving a client does not scale with headcount. Onboarding, documentation, the vCIO relationship, quarterly reviews, firewall and server management, and the account-management overhead cost roughly the same at 20 seats as at 120. Spread across 20 seats that fixed load is punishing per seat; across 120 it nearly disappears. That is why the same service genuinely costs more per user in a small account.
There is a second, quieter effect. Small clients tend to run less standardised environments — one legacy application, one unsupported operating system, one owner who insists on a particular workflow. Non-standard environments consume more engineer time per seat, which reduces the seats-per-engineer figure that sits at the top of the buildup. The cost increase is not a surcharge for being small; it is the arithmetic of the model responding to a real input.
The practical consequence is that quoting from a single company-wide rate card is a mistake in both directions. Quote a 25-seat client at your 120-seat rate and you win an account you lose money on. Quote a 120-seat client at your 25-seat rate and you will not be shortlisted. Run the buildup per prospect, with that prospect’s realistic seats-per-engineer figure, and the rate card falls out of the arithmetic rather than being imposed on it.
How do you price backup and Microsoft 365 protection into a seat?
As a named line item with its own cost basis — never absorbed silently into the bundle. Microsoft 365 backup runs $3–5 per seat per month at typical SMB volumes, and that is a real, recurring, per-user cost that must appear in the tooling line of your buildup. Quoting it as an inclusion without costing it is how a competitive-looking price ends up funding a service you gave away, and forfeits the one conversation that most reliably justifies your rate.
Two reasons to name it explicitly rather than bundle it.
The first is arithmetic. At $4 per seat per month across 100 seats, that is $4,800 a year. If it is not in your cost buildup, it is coming out of your gross margin — and in the worked example above, $4 per seat is 2.4 percent of your break-even cost, which is enough to move a 50 percent margin to 48.6 percent without anyone noticing where it went.
The second is commercial. Most prospects do not know that Microsoft does not back up their data, that the SharePoint recycle bin runs one 93-day clock rather than two, or that Exchange Recoverable Items defaults to fourteen days. A line item forces that conversation, and that conversation is where a price stops being compared to a competitor’s number and starts being compared to the cost of losing a mailbox.
Size that line item against the real exposure rather than a competitor’s number: what Microsoft’s retention windows actually cover sets out the per-service defaults a backup SKU is being sold against.
The same logic applies to infrastructure costs that have moved recently. Virtualisation licensing changes have pushed per-seat infrastructure cost up for any client with on-premises or hosted server workloads, and a rate card written before those changes is quietly absorbing the difference.
The arithmetic is in what licensing changes did to per-seat infrastructure cost.
When per-seat pricing is the wrong model
Three cases. When the client’s risk does not scale with headcount — a twelve-person firm running one critical regulated system carries enterprise risk on a small seat count. When the device-to-user ratio is extreme, as with a manufacturer running forty shared-terminal users against three hundred endpoints. And during a project-heavy onboarding year, when per-seat revenue cannot fund migration labour. Every competing page assumes per-seat is the answer, because per-seat is what they sell.
Take each seriously rather than as a disclaimer.
When risk does not scale with headcount. A twelve-person medical practice, a small fund administrator, a specialist engineering firm holding export-controlled designs — the seat count is trivial and the consequence of a breach is existential. Per-seat pricing will either lose you the deal, because the number looks absurd next to the headcount, or lose you money on it, because you priced twelve seats and are delivering a compliance programme. The honest structure is a base platform fee that reflects the risk surface, plus a per-seat component for the endpoints. It is harder to sell and it is correct.
When the device-to-user ratio is extreme. Manufacturing, logistics, hospitality, healthcare with shared clinical workstations, retail with point-of-sale estates. Forty named users and three hundred endpoints is a per-device client wearing per-seat clothing, and per-seat pricing will underprice it by roughly the ratio between those two numbers. Run the buildup against the unit that actually consumes engineer time. Sometimes that is a person; often it is a device.
During a project-heavy onboarding year. A client arriving with an unsupported server estate, a migration to run and a decade of undocumented decisions will consume more labour in year one than the per-seat contract can fund. Loading that into the recurring rate means either overcharging them for years two through five or undercharging yourself for year one. A separate project rate is honest for both sides, and it removes the temptation to defer necessary work until the contract “catches up.”
What none of these three cases means is that per-seat is a bad model. It is the right model for most standardised SMB engagements, which is precisely why it dominates. It means the model has preconditions — headcount correlates with risk, users correlate with devices, and steady-state work dominates project work — and that naming those preconditions is more useful than defending the model.
Run your own numbers
The formulas are published below, not just their outputs. Substitute your own loaded salary, seats-per-engineer figure, tool stack and target margin, and watch which input actually moves your price. For most operators the answer is seats per engineer, and most operators have never measured it.
Published pricing formula reference:
- Loaded labour per seat:
$110,000 annual burden / 100 assigned seats / 12 = $91.67 - Break-even floor:
$91.67 labour + $30.00 overhead + $45.00 tooling = $166.67 per seat per month - Target price at 50% gross margin:
$166.67 floor / (1 - 0.50) = $333.33 per seat per month, a 100% markup
The divisions run on unrounded values: labour is $91.6667 and the floor is $166.6667, so the target price is $333.33 rather than the $333.34 you get by doubling the rounded floor.
- Measure your actual seats-per-engineer figure this month. Divide seats under management by client-facing engineering headcount. Compare it to the 100 used above.
- Itemise your tool stack per seat. Not the total invoice — per seat, per licence.
- Divide last year’s overhead by average seats under management. Most operators are surprised by this number.
- Re-run your three largest and three smallest accounts through the buildup. Check whether the small ones are carrying the large ones or the reverse.
- Convert your current markup to gross margin using markup ÷ (1 + markup), and compare it to what you believed it was.
The rate survey
The bands in this article come from published guides, and published guides are written by people with a commercial interest in the number. So we are collecting real ones.
Have proprietary benchmark data or regional labour adjustments to contribute? Submit it to our research desk at editorial@infraplaybook.com. Contributions are aggregated and published as medians and ranges with the sample size stated; no individual respondent’s price is ever published against anything that identifies them.
Sources
- The complete MSP pricing guide — benchmarks, models and tiers — the published range this article starts from.
- Managed IT services pricing — cost buildup — labour and overhead components.
- Network and Computer Systems Administrators (SOC 15-1244) — Occupational Employment and Wage Statistics, May 2025 — US Bureau of Labor Statistics, United States. Median annual wage $99,130 ($47.66/hour). Retrieved via O\*NET OnLine, the US Department of Labor surface that republishes the BLS OEWS wage series; the BLS detailed occupation profiles sit behind an interactive application at data.bls.gov rather than a static page. Cross-check: the BLS Occupational Outlook Handbook reports a $96,800 median for the same SOC at May 2024. This is the published anchor for the loaded-cost input, so the arithmetic on this page is reproducible rather than asserted.
- Our own anonymised operator rate survey — primary data, published as medians and quartiles.
1 thought on “MSP Per-Seat Pricing Model & Break-Even Floor (2026)”
Comments are closed.